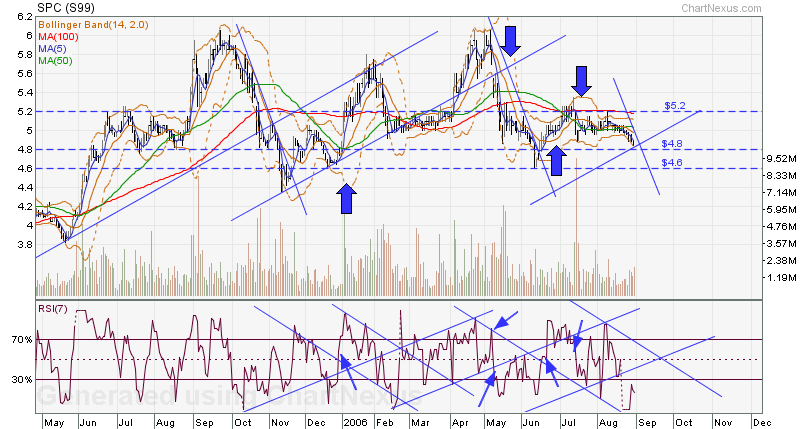
Technically, SPC is very weak and closed on intraday low of 4.84, a
3-month low. Next support at 4.80/4.60 , if price rebound at 4.80 in accordance to the plotted uptrend channel, next significant resistance are at 4.96 and 5.20.Charting our way to winning in the world's biggest casino. Request a stock now and see it charted.
3-month low. Next support at 4.80/4.60 , if price rebound at 4.80 in accordance to the plotted uptrend channel, next significant resistance are at 4.96 and 5.20.Listed since 26 March 2001 on SGX Mainboard, United Food Holdings main business is the production of animal feeds, pigs of quality breeds, fresh, chilled and frozen pork, processed meat products and healthcare supplements in China.
From chart, .245/.23 , resistance at .27. RSI has hit support and momentum indic
ator is turning up, higher probability of price going up soon to test .27. A break og .245 on the other hand, would see price consolidate at .23 level.
From chart, support at .695/.67 , ASL hit .77 and receded, it will be a
strong resistance to overcome in the near term. RSI is turing down from the 70% mark, signalling a sell, momentum indicator is turning down as well. Look to consolidation at the .69-.70 region.
535 while the 61.8% retracement is .605, which happens to be the current resistence that the price had hit a ceiling. Look to consolidation at the .535 to .56 region before testing .605 again as rsi is beginning to turn downwards at the 70% overbought mark.
1.95 is 1.45 while the 61.8% retracement mark is 1.67. As such, 1.45 will be a gd support for HL Asia to launch another upwards assault. From the trend channels drawn, prices may not even touch 1.45 before it resumes trending up to test 1.67 again. RSi is turning up, very high chance of price going up north.
n and rental of PCB-related equipment.Many times, i was asked by people whether they should enter a position for a particular stock. There is really no certain answer for that, cause u have to know why u notice the stock in the first place. Heard from research report? Broker's call? Tips from your broker? Or from a friend who work in that particular listed company? Or you just happen to notice a nice chart formation yourself. Frankly, i would go for a combination of the above factors BUT with a heavier weight on the chart formation part. Next u have to ask yourself what is your timeframe of trading that stock? Buying it for contra? Can u wait for one month with little movement in the price? When u have the answers for the above, the next crucial part is to ask yourself: How much rise in the price will i be satisfied to take profit on? And equally important: How much drop in the price can i endure before cutting it short? When you have the answers of these questions, frankly u can go ahead and trade the stock. There is none other in the whole world u can trust but your very self. Trust your instincts. Others judgement may not necessarily be better. And most importantly, take responsibility on your own actions. This way, you would have little regrets/fears/guilts in trading or not trading a particular stock. Take care of your mental processes and the profitable trades will take care of itself. Gd luck!
past its all-time high at .65 to close at a new high of .685. However, as draw on the chart, it is still below its main uptrend channel resistance. RSI is showing super strength as it maintains itself above the 50% mark since it recovered in early june'06. Significant support for any downside at .635 and .585.
w at a crucial point. Will it breakout of the all-time high or will it retrace back its recent rise? RSI is at the overbought region, however it has not turned down yet. Watch the .95 region; if broken, price may retrace back to support at .85 region. Next support at .76.
00 is at .705 which will be a significant support level after it is surpassed. Currently price has hit the ceiling at .84 and came down. If price fails to consolidate at the .78 region, the testing of resistance at .84 followed by .905 will take quite a while. RSI is showing signs of dropping from the overbought 70% mark, signalling a sell for the moment. Downside is a break of .705 towards .605.

s .26, which should provide support for the price in the mean time. Next significant support at .24. The 61.8% retracement is at .295 which was tested twice recently. Look to a consolidation at the current region for another attemp at .295. Downside risk is a break of .26 towards .24.
e the 38.2% retracement from its low of .64 to its high of .92. If it fails to consolidate at .70 region, next significant support is at .65. On the upside, a breakout of .74 with volume would bring its next target at .81.
rages which serves as important resistances and support levels. Now 1.82 has become a significant support level. the 38.2% retracement from the low of 1.52 to the high of 2.71 is at 1.98, which once broken, would send NOL to 2.12 again. Downside is a breakdown of the 1.80. Next support at 1.73. From chart formation, NOL is trending upwards again in its persisting trend channels.
ST is resuming its main uptrend, which was interrupted during the may-june correction. RSI is showing gd strength which may push it to breakout of the resistance at 2.87 which coincides with the 38.2% retracement from its low of 2.55 to its all-time high of 3.34 achieved in april'06. Significant support at 2.80 followed by 2.67. A breakout from 2.87 would see it return to the $3 region once again. Downside risk is a breakdown of 2.67 towards 2.55.
oment and may consolidate for awhile between the .675-.65 level before staging a rebound. Target at .72 followed by .78. Right now, the moving averages would serve as a resistance and capping any upward thrust at the .72 region.
and recovery of volatile organic compounds. The Group's major operations are in China.
ltural products and food ingredients for customers spread all around the globe.
er a meeting between MM Lee Kuan Yew and the SIA management. MM Lee urged SIA to be more competitive and concentrate on its core biz as a premium airline. There is even talks of it being merged with ST Engg which the latter promptly refuted. Technically, SIA Engineering's price consolidated back to the 3.50s region after going ex-dividend. If it hold up well above 3.50, next target for a rebound is 3.64 followed by 3.78. RSI remains below the 20% oversold mark and it could be a matter of days before it breaks up. Look to the upwards sloping price trendline for likely retracement's direction following a breakout of the rsi.
Recently a member of parliament cited that Minister Mentor Lee Kuan Yew's public comments on the need for SIA to divest its stake in SIA Engineering Company and SATS was an example of government's continued involvement in GLCs. He then suggested that the government found it difficult to take a "hands-off approach" because our GLCs are still in need of guidance from visionaries like MM Lee. Hmm, makes one wonder if he would be as visionary in the stock market..

| adopt your own virtual pet! |
Feed Lucky with its favourite treat for Good Luck before you trade!
| adopt your own virtual pet! |
Heng heng ah! Feed Louhan for Good Luck before you trade!