Saturday, September 23, 2006
Global Testing
Global Testing Corporation Limited provides testing services to the semiconductor industry such as wafersorting and final testing services. The Group's operations are in US and Taiwan and counts among its customers the world's leading foundries namely TSMC and UMC.
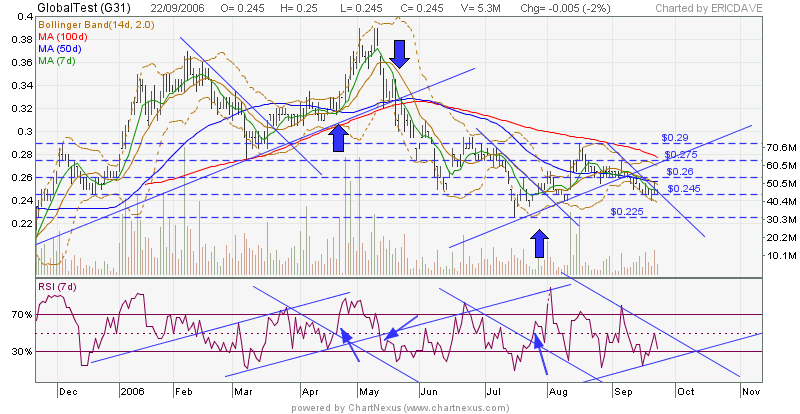
Technically, immediate support is at .245, from RSI we see that it is heading into the 30% oversold region. It is important to observe the price movements at this point; if prices breaks down from .245 and rsi into the oversold region, it means the support established at the previous oversold point has been broken and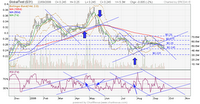 it has effectively entering a new downtrend. On the otherhand, if prices manage to maintain above .245 which rsi enters the oversold zone, prices can be expected to remain rangebound and rally from .245 . Next significant support at .225, next levels of resistance at .26/.275/.29 .
Dear friends, i will be away to my in-camp training from 25th Sep til 6th Oct, in my absence i sincerely hope that you would continue to learn and discuss your views over here. It would be much appreciated if you know something abt technical analysis to give your valuable comments. If you have just started learning TA(its not too late if you havent!) this would be a great opportunity to join in the discussion. I shall now leave you with a thought for the day; 'We may not live forever, but our knowledge will, if we take the time to share.'
Have a profitable weeks ahead! Cheers!
Technically, immediate support is at .245, from RSI we see that it is heading into the 30% oversold region. It is important to observe the price movements at this point; if prices breaks down from .245 and rsi into the oversold region, it means the support established at the previous oversold point has been broken and
 it has effectively entering a new downtrend. On the otherhand, if prices manage to maintain above .245 which rsi enters the oversold zone, prices can be expected to remain rangebound and rally from .245 . Next significant support at .225, next levels of resistance at .26/.275/.29 .
Dear friends, i will be away to my in-camp training from 25th Sep til 6th Oct, in my absence i sincerely hope that you would continue to learn and discuss your views over here. It would be much appreciated if you know something abt technical analysis to give your valuable comments. If you have just started learning TA(its not too late if you havent!) this would be a great opportunity to join in the discussion. I shall now leave you with a thought for the day; 'We may not live forever, but our knowledge will, if we take the time to share.'
Have a profitable weeks ahead! Cheers!
Thursday, September 21, 2006
SPC
As requested by JAMES. Listed since 25 October 1990 on SGX Mainboard, SPC business activities can be classified into Downstream (petroleum refining, trading activities, storage and terminalling of finished products) and Upstream (exploration, development, production, sale of oil and gas and investment in pipelines).
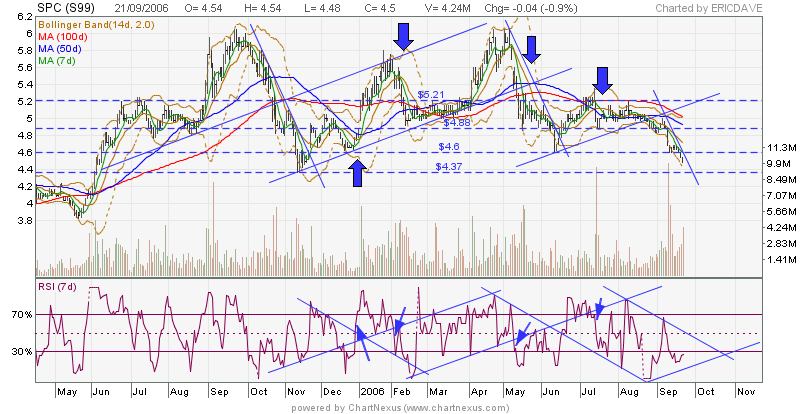
Technically, prices have been steadily declining after reaching recent high of 5.20. The decline in spc's prices is a reportedly attributed to the weakening of crude oil prices, which has affected refining prices for SPC. RSI is trapped within a downtrend zone with next significant support at 4.36. Prices need to stablize at the 4.60 region in order to break away from the downtrend.
Technically, prices have been steadily declining after reaching recent high of 5.20. The decline in spc's prices is a reportedly attributed to the weakening
 of crude oil prices, which has affected refining prices for SPC. RSI is trapped within a downtrend zone with next significant support at 4.36. Prices need to stablize at the 4.60 region in order to break away from the downtrend.
 Wednesday, September 20, 2006
Semb Kim
As requested by james. Listed since 3 February 2000 on SGX Mainboard, Sembawang Kimtrans Ltd is a leading integrated logistics service provider, offering air, land and sea logistics services.
From chart, prices looked set to stage a comeback after touching support at .60 , with resistance at .64 , other support levels at .58/.53 . RSI is trendin g well into an uptrend channel. Using this as an example, if one is to use supp at .60/.58 and resistance at .64 as a reference, the risk/reward ratio would be 1:2 , the risk of falling by .20, the reward of rising .40 .
From chart, prices looked set to stage a comeback after touching support at .60 , with resistance at .64 , other support levels at .58/.53 . RSI is trendin
 g well into an uptrend channel. Using this as an example, if one is to use supp at .60/.58 and resistance at .64 as a reference, the risk/reward ratio would be 1:2 , the risk of falling by .20, the reward of rising .40 .
Memory Devices
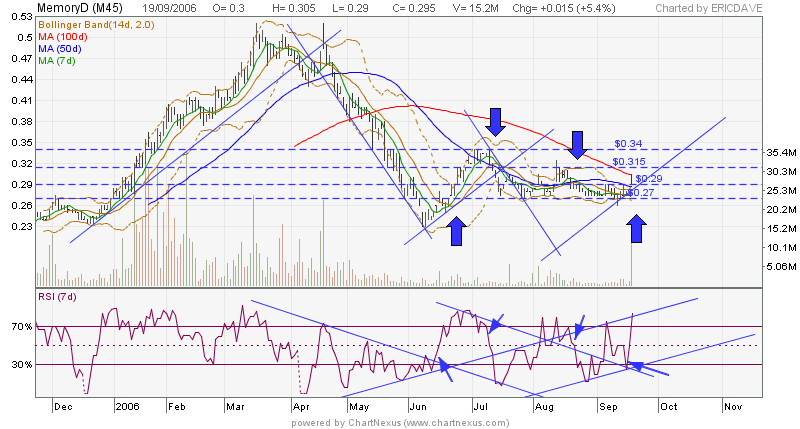
As requested by Elizlow. Memory Devices Limited manufactures and sells solid state memory storage products such as DRAM memory and flash memory modules which are used in a wide variety of products such as computers, notebooks, handphones and cameras. The Group's manufacturing facilities are in China.
Technically, prices broke out of resistance at .29, next resistance at .315 /.34 , with support at .27 . RSI though, had reached the top end of the uptrend channel, hence prices likely to consolidate around .29 for some time before testing .315 .
Technically, prices broke out of resistance at .29, next resistance at .315
 /.34 , with support at .27 . RSI though, had reached the top end of the uptrend channel, hence prices likely to consolidate around .29 for some time before testing .315 .
One point to take note is that any news release in relation to a particular stock has an overriding effect on the stock's chart formation. It may gapped it up or down before resuming its previous formation or even starts a new formation from then on. Take Cosco for example, last three days its been rallying, i suspect those in the know had already loaded up on Cosco, waiting for the news release to offload their shares. This would be a case of buy on rumor, sell on news. Whereas for unexpecting news, it would totally disrupt the stocks current trend. Bio-Treat is an example. Gapped down heavily on the weaker than expected earnings report.
Tuesday, September 19, 2006
Luzhou BioChem
As requested by chamelon. Luzhou Bio-Chem Technology Limited is engaged in the refining of corn, distributing and selling corn-related products such as sweeteners, corn starch, corn gluten meal, corn fibre, corn germ and steepwater. The Group production facilities are in China.
From chart, prices is temporarily supported at .75, resting near the 50MA. Next level of support at .72/.69/.645 with current resistance at .80/.86 . RSI shows weakness, dropping below the 30% mark with prices likely to consolidate further in the near term.
From chart, prices is temporarily supported at .75, resting near the 50MA. Next level of support at .72/.69/.645 with current resistance at .80/.86
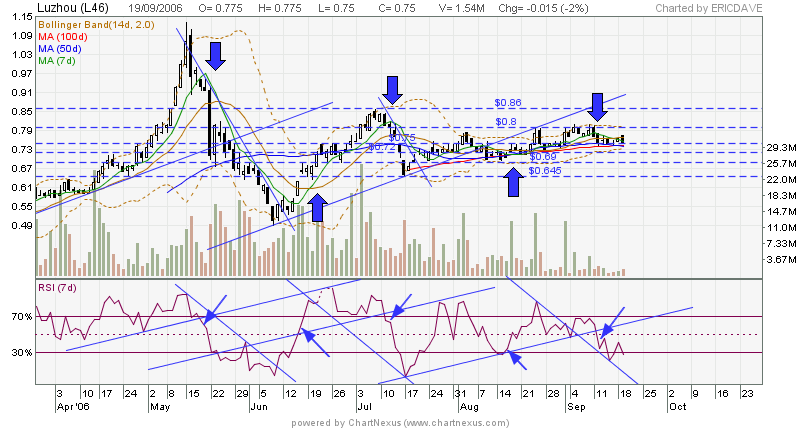 . RSI shows weakness, dropping below the 30% mark with prices likely to consolidate further in the near term.
Monday, September 18, 2006
Utac
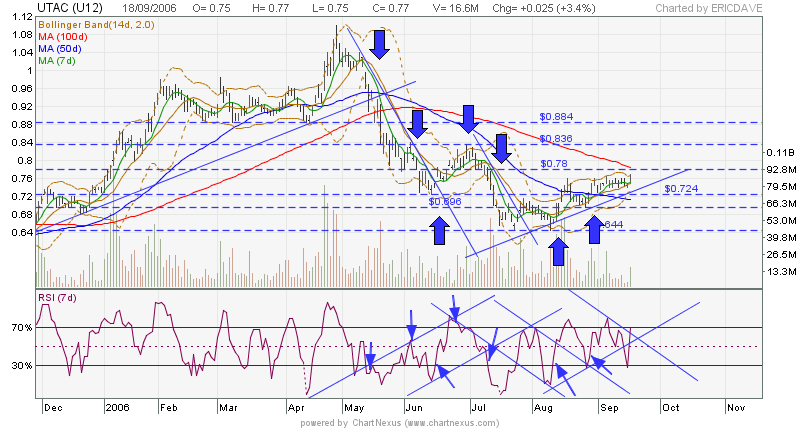
As requested by sunningdale. Listed since 9 February 2004 on SGX Mainboard, United Test & Assembly Center Ltd provides test and assembly services to the semiconductor industry and has been listed as the 9th largest independent provider of semiconductor test in 2002. Headquartered in Singapore, the Group has manufacturing facilities in Singapore and China.
Technically, today prices broke the resistance at .76 and closed at .77 with above average volume. Next res to breakout from is at .78, once taken out convincingly, next significant res lies at .835/.885 . Support is established at .7 25/.695 . RSI shows good strength and is trending nicely upwards towards the overbought zone(above 70%). That does not mean the stock is 'overbought' per se, only when rsi starts to cross the 70% mark downwards that signifies the overbought position is undergoing selling down.
Once again, i do not stress enough the advantages of having a charting software to practice what we are talking here. With every steps we make in practising, we are progressing forward in our stocks' knowledge. I would like to share the thinking process that helps in our decision-making on whether to buy a certain stock; First, do u hv a compelling reason to believe its value will rise in the immediate future? Second, the question we must always ask ourselves before making any trade is: do we know the risk/reward ratio of entering the stock? The potential reward(gain) must outweigh the potential risk(loss) and by as much as possible. How do we know the ratio u ask? The details all in the chart. Where are the resistances and supports, how is the strength of its current trend are all the information we can use to gauge the potential reward(gains) and risk(losses).
Technically, today prices broke the resistance at .76 and closed at .77 with above average volume. Next res to breakout from is at .78, once taken out convincingly, next significant res lies at .835/.885 . Support is established at .7
 25/.695 . RSI shows good strength and is trending nicely upwards towards the overbought zone(above 70%). That does not mean the stock is 'overbought' per se, only when rsi starts to cross the 70% mark downwards that signifies the overbought position is undergoing selling down.
Once again, i do not stress enough the advantages of having a charting software to practice what we are talking here. With every steps we make in practising, we are progressing forward in our stocks' knowledge. I would like to share the thinking process that helps in our decision-making on whether to buy a certain stock; First, do u hv a compelling reason to believe its value will rise in the immediate future? Second, the question we must always ask ourselves before making any trade is: do we know the risk/reward ratio of entering the stock? The potential reward(gain) must outweigh the potential risk(loss) and by as much as possible. How do we know the ratio u ask? The details all in the chart. Where are the resistances and supports, how is the strength of its current trend are all the information we can use to gauge the potential reward(gains) and risk(losses).
Sunday, September 17, 2006
SGX
As requested from the stocks poll. Listed since 23 November 2000 on SGX Mainboard, SGX owns and operates the Securities and Derivative exchanges in Singapore and was the first to introduce an electronic and floorless Securities exchange in Asia.
Technically, SGX has regained the 4.00 foothold, significant suppo rt at 3.90/3.72 , resistance at 4.20/4.50 . From rsi, we see that it entered the overbought zone while prices still failed to break 4.20 which was attained when it last previously reached the overbought zone. This signifies that prices is likely to remain rangebound below 4.20. Watch out for breaking out of 4.20 for any breakthrough.
Technically, SGX has regained the 4.00 foothold, significant suppo
 rt at 3.90/3.72 , resistance at 4.20/4.50 . From rsi, we see that it entered the overbought zone while prices still failed to break 4.20 which was attained when it last previously reached the overbought zone. This signifies that prices is likely to remain rangebound below 4.20. Watch out for breaking out of 4.20 for any breakthrough.
Friday, September 15, 2006
Trading Is War.
As frequent visitors might hv know, I am a military buff and as i will be attending my annual In-Camp Training from 25th Sep to 6th Oct, i feel it is befitting that i give an analogy to trading as liken to being in a war. Treat every single dollar u have as a soldier, $10k as 10,000 soldiers. When you are winning and captured designated objectives, u gain reinforcements, more soldiers, equals more profits. When prices fall, every dollar you lose is a soldier KIA. To minimize losses and prevent more of your men killed, you have to withdraw your men. Cut loss and look for new objectives, new trades. Unfortunately in war as in trading, it is a zero-sum game, your gains is another's losses. The key is really to prevent losses and keep it to a minimum and your gains will take care of itself. Thats how i feel trading should be. And i am still learning everyday, hoping to master it.
(Acknowledgement: the above YouTube clip is extracted from the miniseries Band of Brothers, on the attack led by LTA Richard D. Winters on german artillery batteries attacking the beachheads landings of the Allied forces at Normandy on D-Day. The attack saved many lives of the Allied forces and is still studied in Military schools around the world as a standard attack on objectives under an effective base of fire. Richard D. Winters is awarded the Distinguished Service Cross for his actions.)
Thursday, September 14, 2006
K1 Ventures
Listed since 8 October 1987 on SGX Mainboard, K1 Ventures Ltd is an investment holding company which focuses on identifying and investing in companies with significant gap between the company's current value and potential future value.
Technically, the 61.8% retracement from low of .30 to high of .445 li es on .39, which would be a significant resistance for the mean time. Support at .365/.34 .
Technically, the 61.8% retracement from low of .30 to high of .445 li
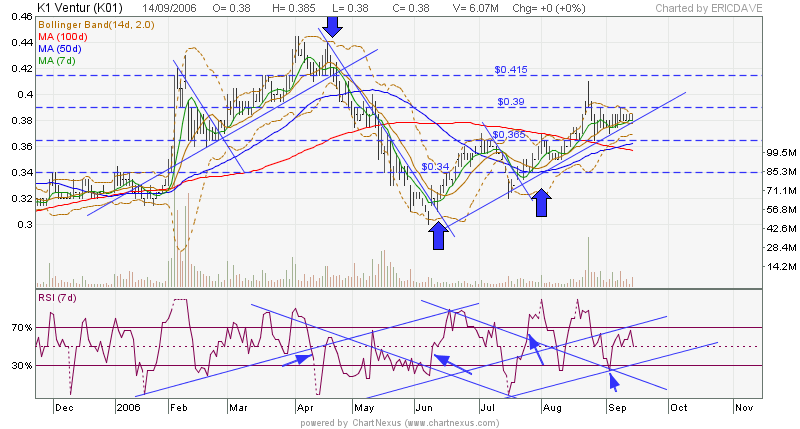 es on .39, which would be a significant resistance for the mean time. Support at .365/.34 .
 All these times, i find that in stocks trading, all of us have our own little style of doing it, which we may or may not consciously notice it. You may particularly buy breakout stocks while i may buy on support, sell on resistance, while she may follow fundamental news to trade. The point is; there is no one right way to trade. Most important thing is to recognize our own preferred style of trading and improve on it, day by day. Only then can trading comes as second nature to you. There is no point in duplicating how another trader trades as we would have learn nothing out the exercise. With this in mind, i wish all of us would find our own path towards profiting in the stock market!
Wednesday, September 13, 2006
KS Energy
As requested by MICH. Listed since 11 March 2002 on SGX Mainboard, KS Tech Ltd is a leading supplier of oil & gas equipment, hydraulic equipment, instrumentation, valves, spares and parts to the oil & gas, marine, mining and petrochemical industries in China and South East Asia.
From chart, prices form a top between 2.55 to 2.43 and when 2.43 was taken out, prices begin its descent until today where the decline was halted at 2.20 region supported by the 50MA and a close 100MA. Expect another significant support at the 2.15 level. RSI is turning up from the oversold region. A rise above todays closing of 2.25 would confirm the reversal.
From chart, prices form a top between 2.55 to 2.43 and when 2.43 was taken out, prices begin its descent until today where the decline was halted
 at 2.20 region supported by the 50MA and a close 100MA. Expect another significant support at the 2.15 level. RSI is turning up from the oversold region. A rise above todays closing of 2.25 would confirm the reversal.
 China Precision
China Precision Technology Ltd provides integrated manufacturing services to the consumer electronics, automation equipment, telecommunication and automotive industries. The Group's major manufacturing industries are in China and counts Samsung Group, Sony Group, Toshiba Group, LG Group and Panasonic Group among its customers.
From chart, prices turned down after hitting high of .43, with rsi i n the overbought zone. Ideally, we would want price to break resistance .43 with rsi rising above the 70% mark, however that did not materialise, hence look to consolidation at the .40 level again before staging another attempt for a breakthrough. Next support at .375/.355.
From chart, prices turned down after hitting high of .43, with rsi i
 n the overbought zone. Ideally, we would want price to break resistance .43 with rsi rising above the 70% mark, however that did not materialise, hence look to consolidation at the .40 level again before staging another attempt for a breakthrough. Next support at .375/.355.
Monday, September 11, 2006
Xpress
As requested by rog. Listed since 28 June 1999 on SGX Mainboard, Xpress Holdings main focus is in the financial printing market namely equity research reports, corporate annual reports, Initial Public Offer prospectuses and mutual fund documents.
Technically, prices broke through resistance at .185 as rsi continues t o remain above the 70% mark signalling a strong uptrend. Next resistance at .215/.235, support at .165/.145 .
One technique of using RSI is to see if prices breaks through any resistance as its rsi enters the 70% overbought region. If it doesnt, then prices are expected to remain rangebound. The same applies to the downside, when rsi enters the 30% oversold region, do prices break down below any support? If they do not, then prices are expected to rebound and remain rangebound.
Technically, prices broke through resistance at .185 as rsi continues t
 o remain above the 70% mark signalling a strong uptrend. Next resistance at .215/.235, support at .165/.145 .
One technique of using RSI is to see if prices breaks through any resistance as its rsi enters the 70% overbought region. If it doesnt, then prices are expected to remain rangebound. The same applies to the downside, when rsi enters the 30% oversold region, do prices break down below any support? If they do not, then prices are expected to rebound and remain rangebound.
Sunday, September 10, 2006
Sunray
As requested by Exdous. Listed since 5 November 2003 on SGX Mainboard, Sunray Holdings Ltd is a manufacturer and supplier of medical apparatus such as obstetrics and gynaecology systems and neurophysiological systems. The Group products are marketed to hospitals in China.
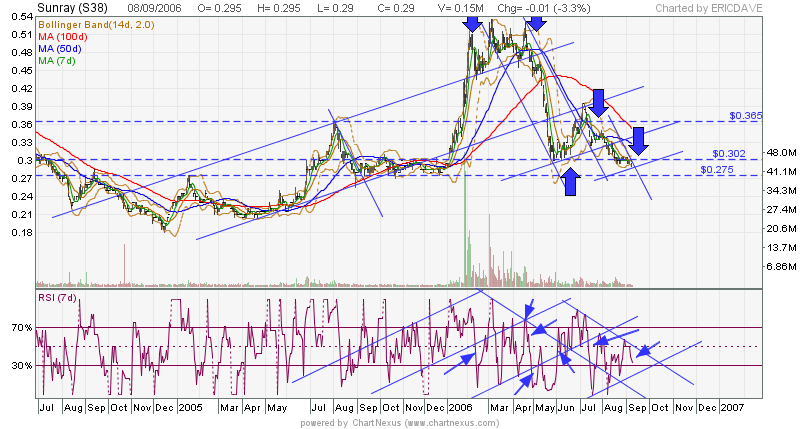
From chart, Sunray is technically weak after breaking down from support a t .30 level albeit with low volume. Prices could slid down to teh .275 region if it does not stable itself along the upwards-sloping trendline. Its weakness is shown by the rsi as it is trapped within a downward-sloping trend channel at the moment.
From chart, Sunray is technically weak after breaking down from support a
 t .30 level albeit with low volume. Prices could slid down to teh .275 region if it does not stable itself along the upwards-sloping trendline. Its weakness is shown by the rsi as it is trapped within a downward-sloping trend channel at the moment.
Thursday, September 07, 2006
China Hong
As requested by shrek. China Hongxing Sports Limited designs and manufactures sports shoes as well as other sports apparel and sports accessories in its production facilities in China. The Group markets its products under the Erke brand.
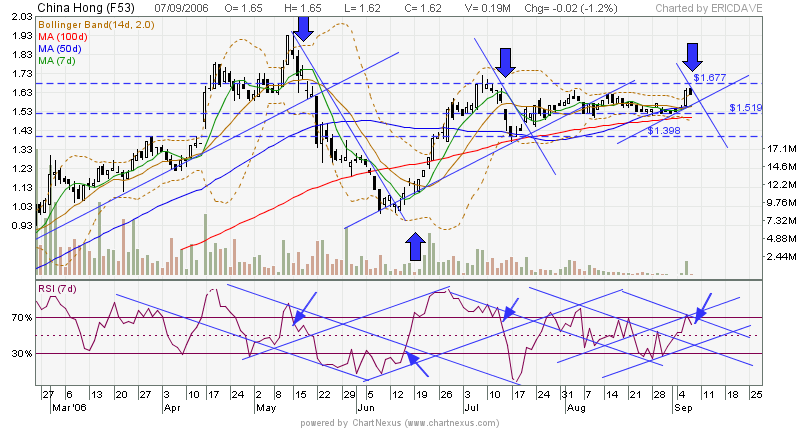
From chart, rsi has turned down from the 70% mark, signalling a sell. Support at 1.52/1.40. Next target after consolidation along the trend channel, stands at 1.68.
From chart, rsi has turned down from the 70% mark, signalling a sell. Support at 1.52/1.40. Next target after consolidation along the trend channel, stands at 1.68.
Wednesday, September 06, 2006
Fung Choi
As requested by ateo. Listed since 20 October 2004 on SGX Mainb oard, Fung Choi Prntg & Pckg Grp Ltd provides printing solutions such as commercial printing and packaging printing. The Group also manufactures a wide range of corrugated cardboard packaging products.
From chart, the lastline of defence is at .59, volume is shrinking on past few days of gradual declines. MACD is turning positive, with the faster(short) MA about to cross the slower(long) MA, a sign of reversal. Next resistance at .69/.745/.82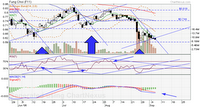 .
.
 oard, Fung Choi Prntg & Pckg Grp Ltd provides printing solutions such as commercial printing and packaging printing. The Group also manufactures a wide range of corrugated cardboard packaging products.
From chart, the lastline of defence is at .59, volume is shrinking on past few days of gradual declines. MACD is turning positive, with the faster(short) MA about to cross the slower(long) MA, a sign of reversal. Next resistance at .69/.745/.82
 .
. Tuesday, September 05, 2006
Wilmar
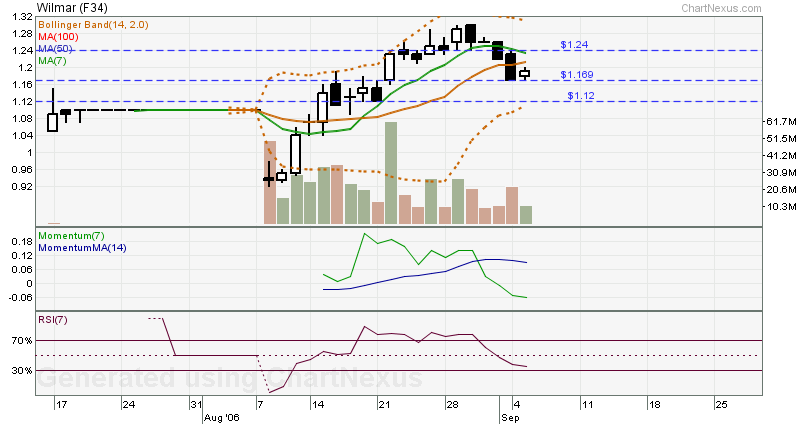
As requested by cas. Wilmar International Limited is a palm oil refiner as well as crushers of copra and palm kernel. The Group also owns sizeable oil palm plantations in Indonesia.
Wilmar became listed after a reverse takeover oof Ezyhealth. Basically how reverse takeover works is that a reverse takeover (RTO), also known as a back door listing, or a reverse merger, is a financial transaction that results in a privately-held company becoming a publicly-held company without going the traditional route of filing a prospectus and undertaking an init
 ial public offering (IPO). Rather, it is accomplished by the shareholders of the private company selling all of their shares in the private company to the public company in exchange for shares of the public company. There are many advantages why private companies would take the RTO route, one of which is the lower cost compared to a straight IPO. While the transaction is technically a takeover of the private company by the public company, it is called a reverse takeover because the public company involved is typically a "shell" (also known as a "blank cheque company", "capital pool company" or "cash shell company") and it typically issues such a large number of shares to acquire the private company that the former shareholders of the private company end up controlling the public company.
From chart, support is at 1.12/1.17, resistance at 1.24. 1.17 is the 38.2% retracement from high of 1.30 to low of .935. On today's close, price rebounded from 1.17. Look for a confirmation sign on tomorrow price action for a reversal play.
Monday, September 04, 2006
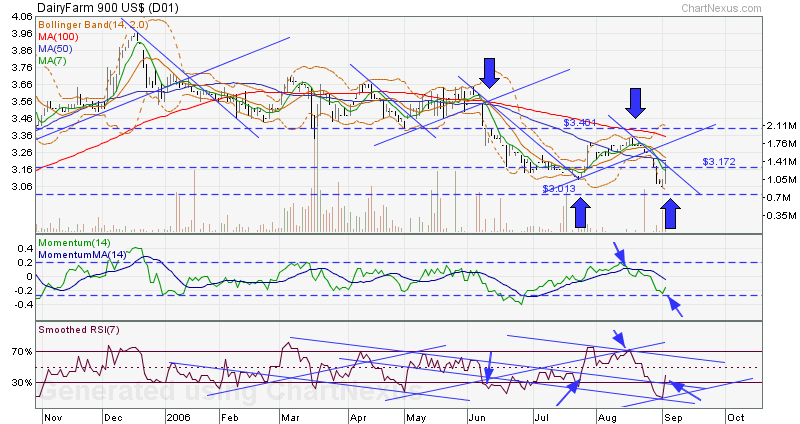
Dairy Farm
As request by Ace. Listed since 20 February 1991 on SGX Mainboard, Dairy Farm International Holdings Ltd is a leading retail player with numerous retail stores such as supermarkets, hypermarkets, health and beauty stores, convenience stores, home furnishings stores and restaurants located all over Asia.
From chart, today price shoot up from yesterday's 'doji', confirmi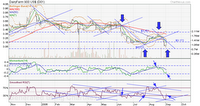 ng the reversal. In the process, it had also brokeout of resistance at 3.18, but closed lower at 3.14 on market close. Once 3.18 is convincingly broken, next target for Dairy farm is at 3.46.
From chart, today price shoot up from yesterday's 'doji', confirmi
 ng the reversal. In the process, it had also brokeout of resistance at 3.18, but closed lower at 3.14 on market close. Once 3.18 is convincingly broken, next target for Dairy farm is at 3.46.
Saturday, September 02, 2006
Olam
Listed since 11 February 2005 on SGX Mainboard, Olam International Limited provides supply chain solutions to global companies such as Kraft, Cadbury, Mars and Nestle. The Group sources agricultural products and food ingredients for customers spread all around the globe.
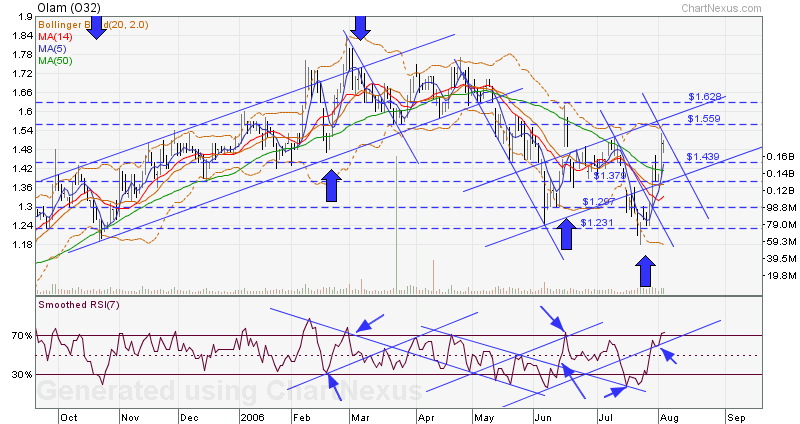
Technically, the breakout from the 1.50-1.54 region, which happens to the 61.8% retracement from low of 1.18 to high of 1.77, send Olam rocketi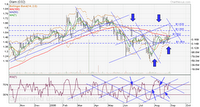 ng upwards. From trend channels of its rsi, price has higher probablilty of consolidating at the 1.50-1.54 region before breaking through to the 1.60s region convincingly. Notice the 1.40 level, which is where the 50 MA lies. It would provide significant support for any adverse movement south.
Technically, the breakout from the 1.50-1.54 region, which happens to the 61.8% retracement from low of 1.18 to high of 1.77, send Olam rocketi
 ng upwards. From trend channels of its rsi, price has higher probablilty of consolidating at the 1.50-1.54 region before breaking through to the 1.60s region convincingly. Notice the 1.40 level, which is where the 50 MA lies. It would provide significant support for any adverse movement south.
Subscribe to:
Comments (Atom)


